Photo by Sam Moghadam on Unsplash
Monitor and Optimize On-Premises Data Gateway Performance
Gateway performance monitoring


Download the Gateway Performance PBI template file from this link.
Note — This feature is currently available only for the on-premises data gateway in the standard mode. It’s not available for the personal mode.
Gateway diagnostics doesn't capture diagnostics directly related to the (virtual) machine and its network, like bandwidth or latency. However, these diagnostics might impact your gateway performance. You can use resource monitoring tools to monitor your machine.
The on-premises data gateway is a critical component for enabling seamless data flow between your on-premises data sources and various Microsoft cloud services like Power BI, Power Apps, and Azure Logic Apps. Ensuring optimal gateway performance is vital for minimizing delays and improving efficiency in data operations.
This guide will provide insights into monitoring gateway performance, understanding logs, and implementing performance optimization techniques to maximize efficiency.
1. Gateway Performance Monitoring (Public Preview)
Traditionally, gateway admins relied on manually tracking performance counters through Windows Performance Monitor. However, Microsoft now offers additional query logging and a Gateway Performance PBI template for visualizing results. These features provide deeper insights into gateway usage and make it easier to troubleshoot slow-performing queries.

Key Features of Gateway Performance Monitoring
Query Logging: Enables detailed logging of gateway activities, including query execution and processing durations.
PBI Template File: Visualizes gateway performance data for better analysis and troubleshooting.
Limitations:
Available only for gateways in standard mode, not personal mode.
Diagnostics do not capture machine-specific factors like bandwidth or latency. Use resource monitoring tools for such metrics.
Configuring Performance Logging
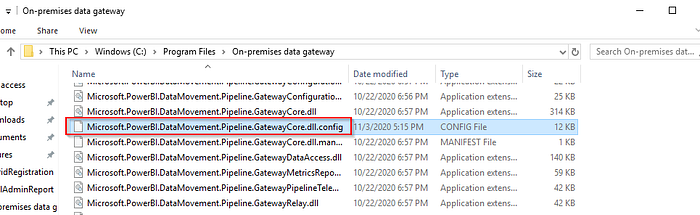
Performance logging is enabled by default. You can adjust the configuration in the gateway’s Microsoft.PowerBI.DataMovement.Pipeline.GatewayCore.dll.config file located at:C:\Program Files\On-premises data gateway
Here are some key configuration settings:
ReportFilePath: Determines the path where the four log files are stored. By default, this path is either \Users\PBIEgwService\AppData\Local\Microsoft\On-premises data gateway\Report or \Windows\ServiceProfiles\PBIEgwService\AppData\Local\Microsoft\On-premises data gateway\Report. The path depends on the OS version. If you use a service account for the gateway other than PBIEgwService, replace this part of the path with the service account name.
ReportFileCount: Determines the number of log files of each kind to retain. The default value is 10.
ReportFileSizeInBytes: Determines the size of the file to maintain. The default value is 104,857,600.
QueryExecutionAggregationTimeInMinutes: Determines the number of minutes for which the query execution information is aggregated. The default value is 5.
SystemCounterAggregationTimeInMinutes: Determines the number of minutes for which the system counter is aggregated. The default value is 5.
After modifying the configuration, restart the gateway for changes to take effect. Logs will begin appearing in the specified folder within 10 minutes plus the configured aggregation time.
2. Understanding Performance Logs
When enabled, performance logging generates four main log files, each capturing specific aspects of gateway performance:
The Query Execution Report
The Query Start Report
The Query Execution Aggregation Report
The System Counter Aggregation Report
1. Query Execution Report
Contains detailed information on query execution, including:
QueryExecutionDuration: Total query execution time.
Success: Indicates if the query was successful.
SpoolingDiskWritingDuration: Time spent writing data to disk.
DataReadingAndSerializationDuration: Time to read and serialize data from the source.
| Attribute | Description |
| GatewayObjectId | Unique identifier for the gateway. |
| RequestId | Unique identifier for a gateway request. It could be the same for multiple queries. |
| DataSource | Contains both the data source type and data source. |
| QueryTrackingId | Unique identifier for a query. It may however repeat if a query fails and is retried. |
| QueryExecutionEndTimeUTC | Time when the query execution completed. |
| QueryExecutionDuration (ms) | Duration for a query execution. |
| QueryType | Type of query. For instance, the query passed could be a Power BI refresh or DirectQuery. Or, it could be queries from Power Apps and Power Automate. |
| DataProcessingEndTimeUTC | Time when data processing activities like spooling, data retrieval, compression, and data processing completed. |
| DataProcessingDuration (ms) | Duration for data processing activities like spooling, data retrieval, compression, and data processing. |
| Success | Indicates if the query succeeded or failed. |
| ErrorMessage | If the query failed, indicates the error message. |
| SpoolingDiskWritingDuration (ms) | Indicates the amount of time by the gateway to write all data to disk |
| SpoolingDiskReadingDuration (ms) | Indicates the amount of time by the gateway to read all data to disk |
| SpoolingTotalDataSize (bytes) | Size(Compressed) of the data that is written to/read from disk |
| DataReadingAndSerializationDuration (ms) | Indicates the amount of time the gateway takes to read data from the datasource and serialize them into packets. |
| DiskRead (byte/sec) | Indicates bytes read by the gateway per second. DiskRead(byte/sec) = SpoolingTotalDataSize / SpoolingDiskReadingDuration |
| DiskWrite (byte/sec) | Indicates bytes written by the gateway per second. DiskWrite(byte/sec) = SpoolingTotalDataSize / SpoolingDiskWritingDuration |
2. Query Start Report
Logs query initiation details, including:
QueryExecutionStartTime: Start time of query execution.
QueryText: The complete base64-encoded query text.
| Attribute | Description |
| GatewayObjectId | Unique identifier for the gateway. |
| RequestId | Unique identifier for a gateway request. It could be the same for multiple queries. |
| DataSource | Contains both the data source type and data source. |
| QueryTrackingId | Unique identifier for a query. It may however repeat if a query fails and is retried. |
| QueryExecutionStartTimeUTC | Time when the query execution started. |
| QueryType | Type of query. For instance, the query passed could be a Power BI refresh or DirectQuery. Or, it could be queries from Power Apps and Power Automate. |
| QueryText | Complete query encoded with base64. |
| EvaluationContext | Contains the artifactId (ie., datasetid for semantic models, dataflowsId, etc.) along with additional trace ids depending on the artifact. Note that this field only populates for supported workloads in Fabric, Power Platform, Azure Analysis Services, and certain connectors in Azure Logic Apps. These include: Semantic Models, Dataflow Gen2, and Power Platform dataflows. It also includes Azure Logic Apps workloads for the Mashup Query, HTTP, and File Azure connectors. The value will contain different trace IDs depending on the workload used. Power BI and Fabric Dataflows Gen 1 and Power BI Paginated Reports is not supported. |
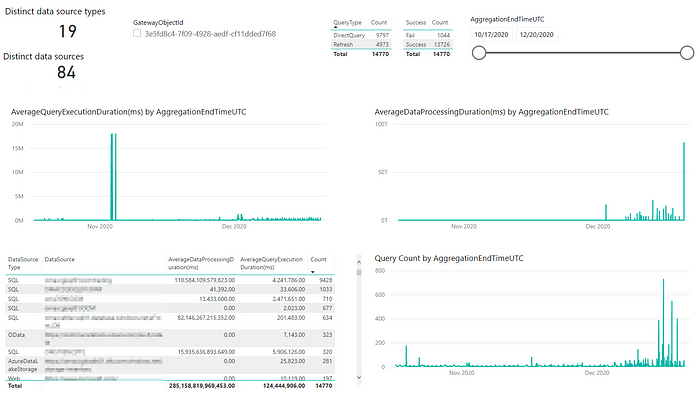
3. Query Execution Aggregation Report
Aggregates query execution data over a defined time interval (default: 5 minutes), including metrics like:
AverageQueryExecutionDuration: Average execution time within the aggregation window.
QueryType: Specifies the query type, such as Power BI refresh or DirectQuery.
| Attribute | Description |
| GatewayObjectId | Unique identifier for the gateway. |
| AggregationStartTimeUTC | Start of the time window for which query attributes were aggregated. |
| AggregationEndTimeUTC | End of the time window for which query attributes were aggregated. |
| DataSource | Contains both the data source type and data source. |
| Success | Indicates if the query succeeded or failed. |
| AverageQueryExecutionDuration (ms) | Average query execution time for the aggregation time window. |
| MaxQueryExecutionDuration (ms) | Maximum query execution time for the aggregation time window. |
| MinQueryExecutionDuration (ms) | Minimum query execution time for the aggregation time window. |
| QueryType | Type of query. For instance, the query passed could be a Power BI refresh or DirectQuery. Or, it could be queries from Power Apps and Power Automate. |
| AverageDataProcessingDuration (ms) | Average time for data processing activities like spooling, data retrieval, compression, and data processing for the aggregation time window. |
| MaxDataProcessingDuration (ms) | Maximum time for data processing activities like spooling, data retrieval, compression, and data processing for the aggregation time window. |
| MinDataProcessingDuration (ms) | Minimum time for data processing activities like spooling, data retrieval, compression, and data processing for the aggregation time window. |
| Count | Number of queries. |
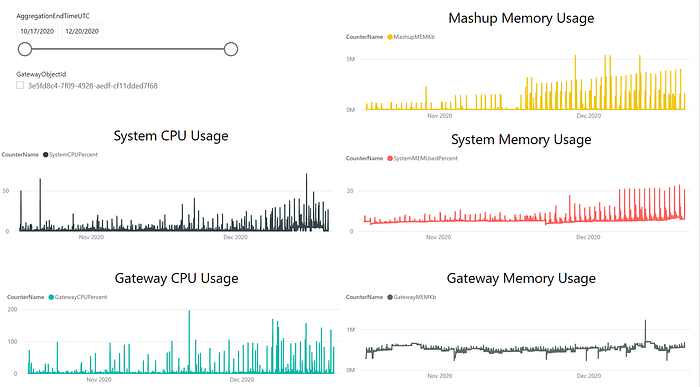
4. System Counter Aggregation Report
Aggregates system resource usage, such as:
SystemCPUPercent: CPU usage as a percentage of total CPU capacity.
SystemMEMUsedPercent: Memory usage as a percentage of total available memory.
GatewayCPUPercent: Gateway-specific CPU usage.
| Attribute | Description |
| GatewayObjectId | Unique identifier for the gateway. |
| AggregationStartTimeUTC | Start of the time window for the system counters that were aggregated. |
| AggregationEndTimeUTC | End of the time window for the system counters that were aggregated. |
| CounterName | System counters each apply to one server that is hosting a gateway node and include: |
• SystemCPUPercent: CPU used on the server as a percentage of total available CPU.
• SystemMEMUsedPercent: Memory used on the server as a percentage of total available memory.
• GatewayCPUPercent: The sum of the percent of CPU used by the gateway process on each core. To get the percent of the CPU used on the server, divide GatewayCPUPercent by the number of cores.
• GatewayMEMKb: Sum of the total memory in kilobytes used by the gateway process. |
| Max | Maximum value for the system counter for the aggregation time window. |
| Min | Minimum value for the system counter for the aggregation time window. |
| Average | Average value for the system counter for the aggregation time window. |
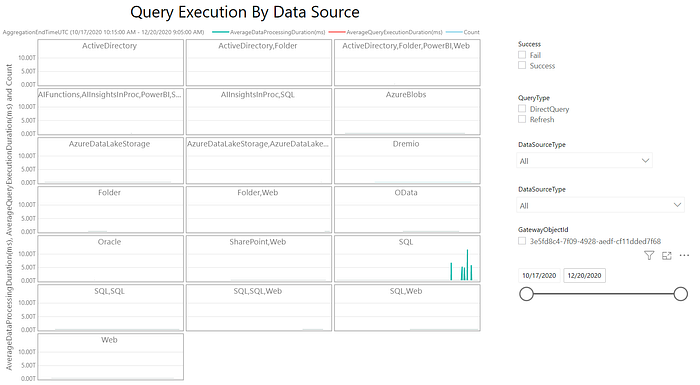
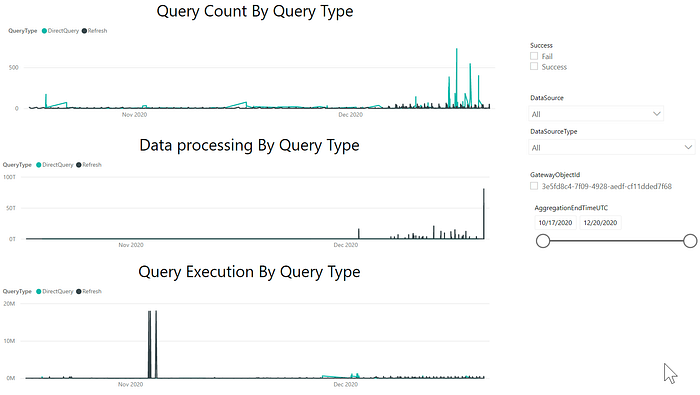
3. Visualizing Gateway Performance
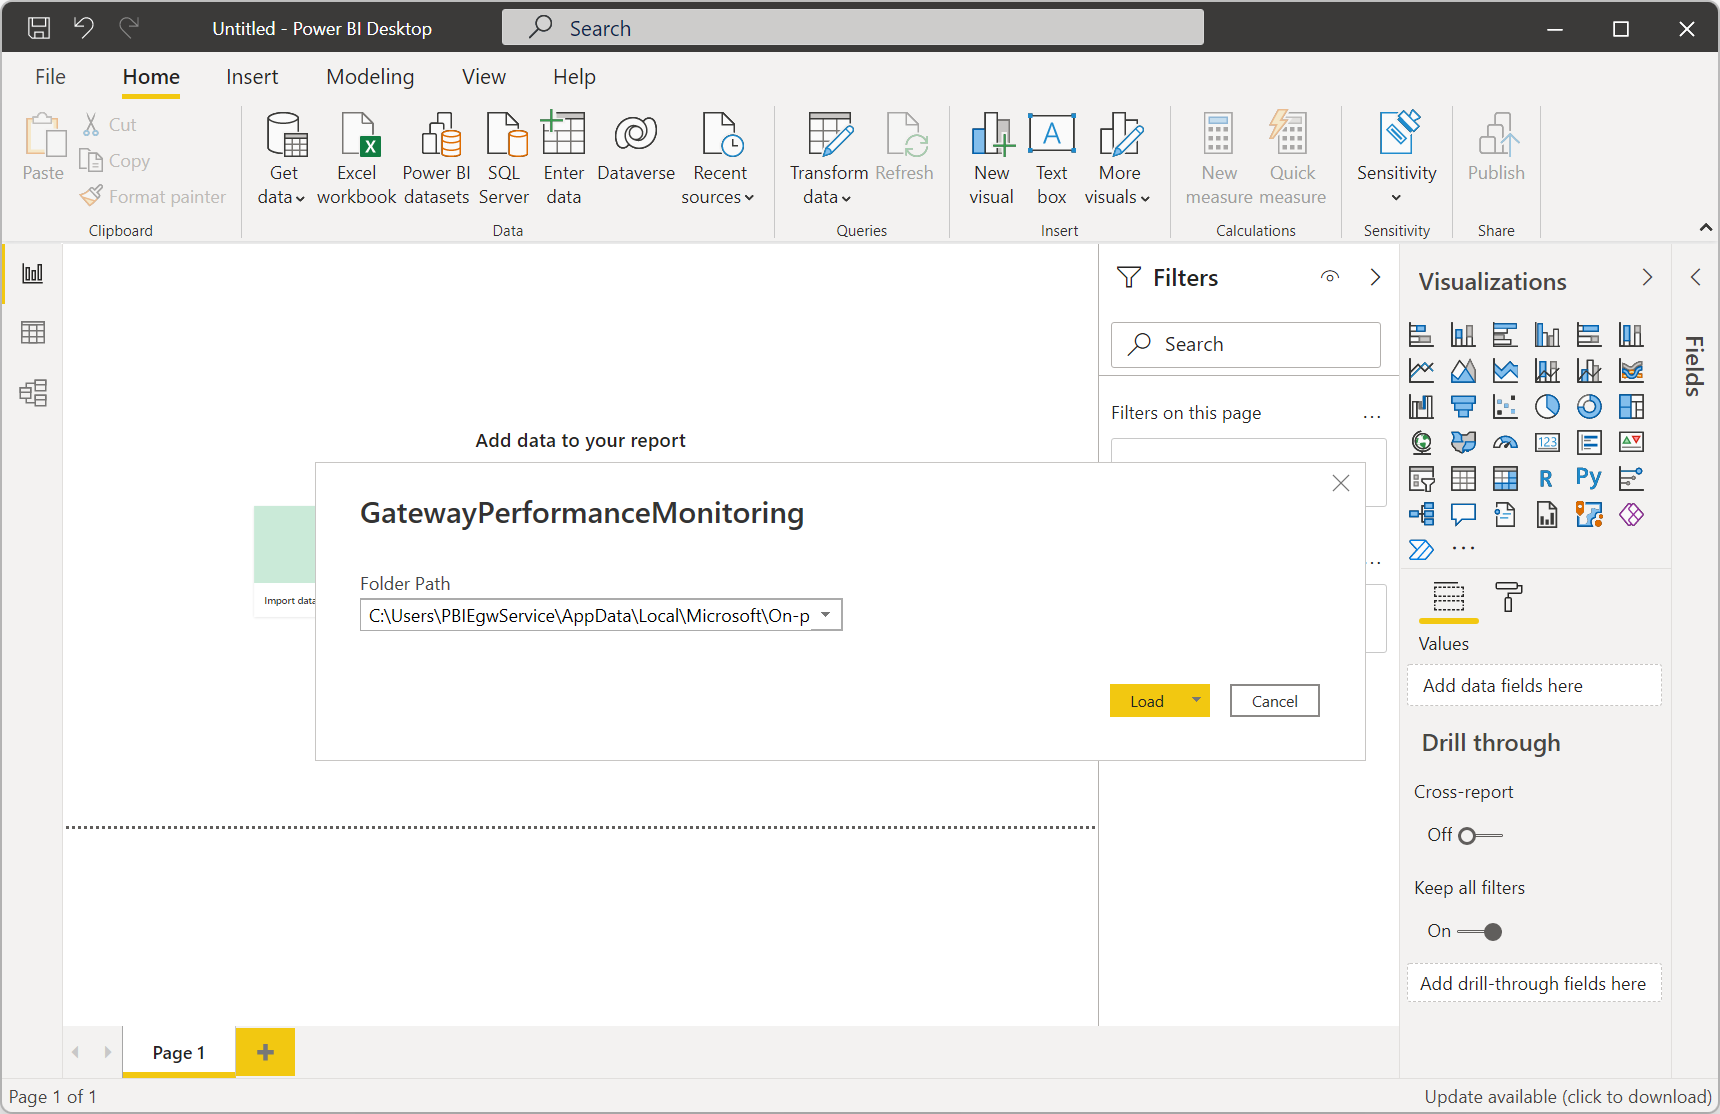
To analyze the collected data, use the Gateway Performance PBI template:
Download the PBI Template: Open it in Power BI Desktop.
Specify the Log File Path: Ensure the folder path matches the value configured in
ReportFilePath.Load and Visualize: Select
Load, and the template will populate visuals with data from your log files.Optional: Save the file as a PBIX file and publish it to the Power BI service for automated refreshes.
4. Optimizing Gateway Performance
1. Monitor Spool Storage
The gateway uses spool storage for temporary data during processing. By default, spool storage is located at:C:\Users\PBIEgwService\AppData\Local\Microsoft\On-premises data gateway\Spooler
Monitor this directory to ensure adequate free disk space.
2. Address Slow-Performing Queries
Long-running queries may require:
Source Optimization: Adjust queries or indexes on the data source.
Additional Logging: Temporarily enable verbose logging for more detailed query insights. Enable this via Diagnostics > Additional Logging in the gateway app.
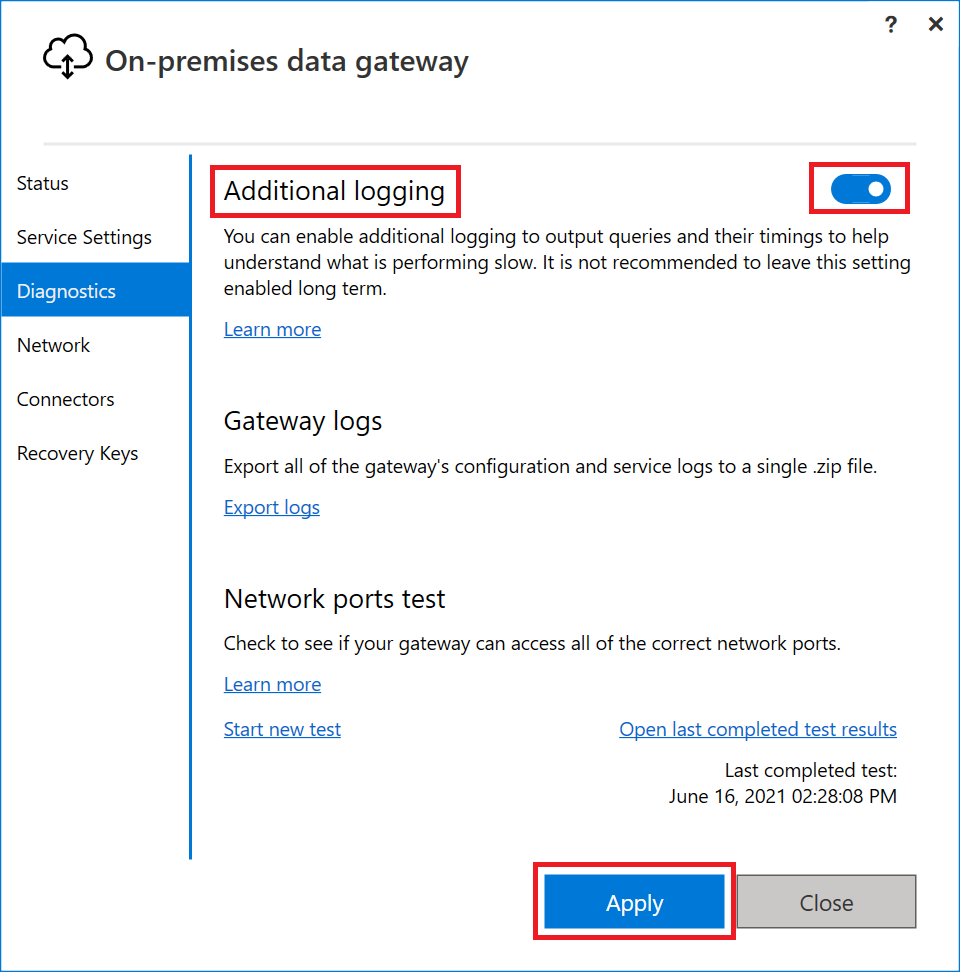
Note: Disable additional logging after troubleshooting to avoid excessive log sizes.
3. Stream Data Instead of Spooling
By default, the gateway spools data before returning it to the semantic model, which can slow down performance. To enable streaming:
Open the
Microsoft.PowerBI.DataMovement.Pipeline.GatewayCore.dll.configfile.Set
StreamBeforeRequestCompletestoTrue:
<setting name="StreamBeforeRequestCompletes" serializeAs="String">
   <value>True</value>
</setting>
- Restart the gateway in Service Settings for changes to take effect.
Note: Enabling StreamBeforeRequestCompletes may cause query reliability issues when using slow data sources or with unstable/limited network connections.
4. Exclude Folders from Antivirus Scanning
Exclude key gateway directories from antivirus scanning to prevent performance issues. Common folders to exclude include:
Note: The following place holder Drive represents the letter of the drive on which the on-premises data gateway is installed. Typically, the driver letter is C. The following place holder ServiceAccount represents the service account that's running the on-premises data gateway. The default account is PBIEgwService.
Logging directory:
Drive:\Windows\ServiceProfiles\ServiceAccount\AppData\Local\Microsoft\On-premises data gatewaySpool storage directory:
Drive:\Windows\ServiceProfiles\ServiceAccount\AppData\Local\Microsoft\On-premises data gateway\Spooler
Replace ServiceAccount with the service account name running the gateway (default: PBIEgwService).
5. Next Steps
To ensure continued performance and efficiency:
Regularly monitor gateway logs using the PBI template.
Adjust configurations based on query performance trends.
Stay informed about gateway updates and features to leverage the latest capabilities.
For more information, visit the official On-Premises Data Gateway Documentation.
By implementing these monitoring and optimization strategies, you can ensure that your on-premises data gateway operates at peak efficiency, supporting seamless data operations across your organization.
Aggregation
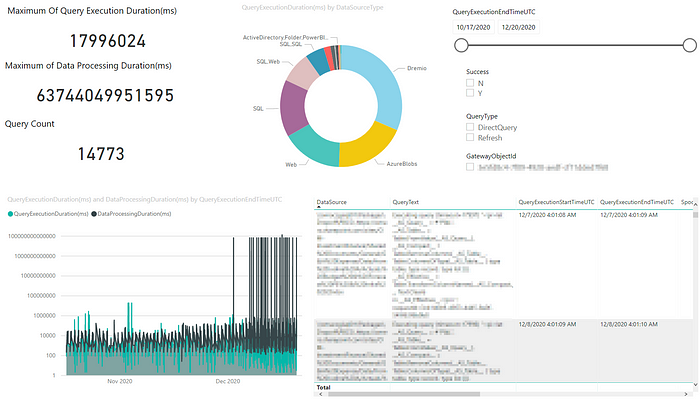
Details
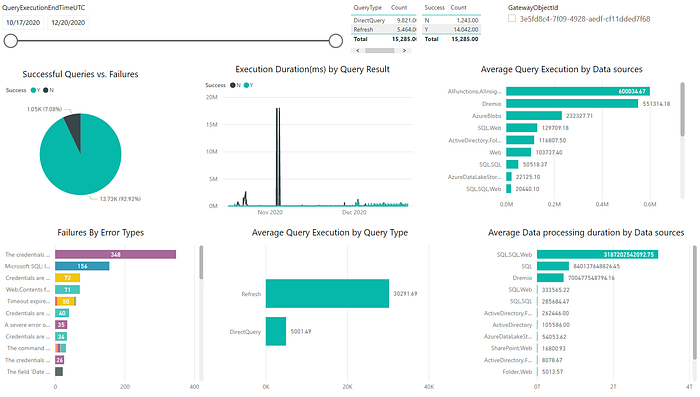
Average Execution and Errors
System Counters Over Time
Query Execution by Data Source
Query Count by Query Type
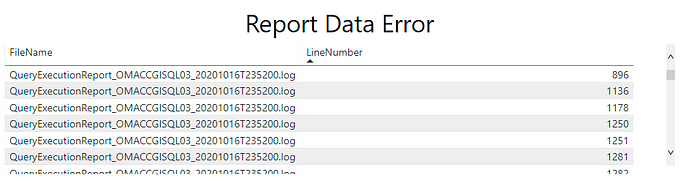
Report Data Error