Power BI Migration
Guidance on how to plan and conduct a migration from a third-party BI tool to Power BI

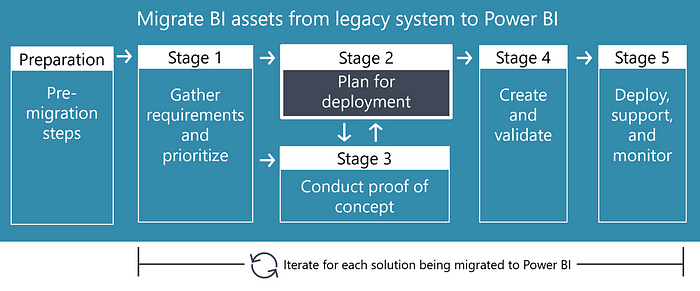
4 high-level phases for deploying Power BI
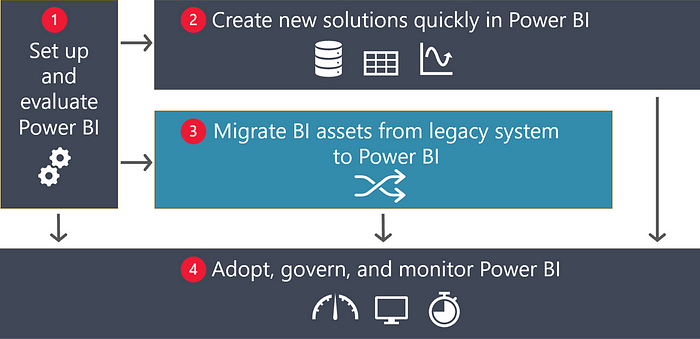

Set up and evaluate Power BI. The first phase involves establishing the initial Power BI architecture. Preliminary deployment and governance planning are handled at this point, as well as Power BI evaluations including return on investment and/or cost benefit analysis.

Create new solutions quickly in Power BI. In the second phase, self-service BI authors can begin using and evaluating Power BI for their needs, and value can be obtained from Power BI quickly. Activities in Phase 2 place importance on agility and rapid business value, which is critical to gaining acceptance for the selection of a new BI tool such as Power BI. For this reason, the diagram depicts activities in Phase 2 happening side by side with the migration activities in Phase 3.

Migrate BI assets from legacy platform to Power BI. The third phase addresses the migration to Power BI. It’s the focus of this series of Power BI migration articles. Five specific migration stages are discussed in the next section.

Adopt, govern, and monitor Power BI. The final phase comprises ongoing activities such as nurturing a data culture, communication, and training. These activities greatly impact on an effective Power BI implementation. It’s important to have governance and security policies and processes that are appropriate for your organization, as well as auditing and monitoring to allow you to scale, grow, and continually improve.
Five stages of a Power BI migration
Phase 3 of the diagram addresses migration to Power BI. During this phase, there are five common stages.
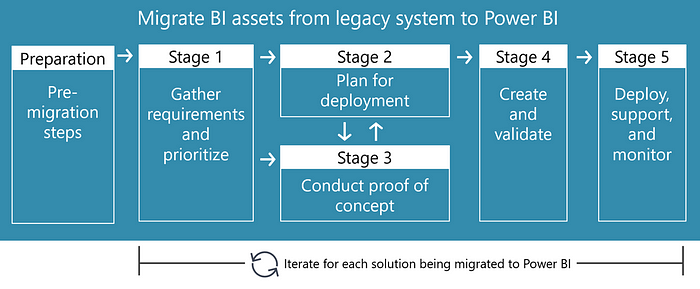
The following stages shown in the previous diagram are:
Pre-migration steps — The pre-migration steps include actions you may consider prior to beginning a project to migrate content from a legacy BI platform to Power BI. It typically includes the initial tenant-level deployment planning.
Stage 1: Gather requirements and prioritize — The emphasis of Stage 1 is on gathering information and planning for the migration of a single solution. This process should be iterative and scoped to a reasonable sized effort. The output for Stage 1 includes a prioritized inventory of reports and data that are to be migrated. Additional activities in Stages 2 and 3 are necessary to fully estimate the level of effort.
Stage 2: Plan for deployment — The focus of Stage 2 is on how the requirements defined in Stage 1 may be fulfilled for each specific solution. The output of Stage 2 includes as many specifics as possible to guide the process, though it is an iterative, non-linear process. Creation of a proof of concept (in Stage 3) may occur in parallel with this stage. Even while creating the solution (in Stage 4), additional information may come to light that influences deployment planning decisions. This type of deployment planning in Stage 2 focuses on the solution level, while respecting the decisions already made at the organizational level.
Stage 3: Conduct proof of concept — The emphasis of Stage 3 is to address unknowns and mitigate risks as early as possible. A technical proof of concept (POC) is helpful for validating assumptions, and it can be done iteratively alongside deployment planning (Stage 2). The output of this stage is a Power BI solution that’s narrow in scope. Note that we don’t intend for the POC to be disposable work. However, it will likely require additional work in Stage 4 to make it production-ready. In this respect, in your organization, you may refer to this activity as either a prototype, pilot, mockup, quickstart, or minimally viable product (MVP). Conducting a POC isn’t always necessary and it can be done informally.
Stage 4: Create and validate content — Stage 4 is when the actual work to convert the POC to a production-ready solution is done. The output of this stage is a completed Power BI solution that’s been validated in a development environment. It should be ready for deployment in Stage 5.
Stage 5: Deploy, support, and monitor — The primary focus of Stage 5 is to deploy the new Power BI solution to production. The output of this stage is a production solution that’s actively used by business users. When using an agile methodology, it’s acceptable to have some planned enhancements that will be delivered in a future iteration. Depending on your comfort level with Power BI, such as minimizing risk and user disruption, you may choose to do a staged deployment. Or, you might initially deploy to a smaller group of pilot users. Support and monitoring are also important at this stage, and on an ongoing basis.
Prepare to migrate to Power BI
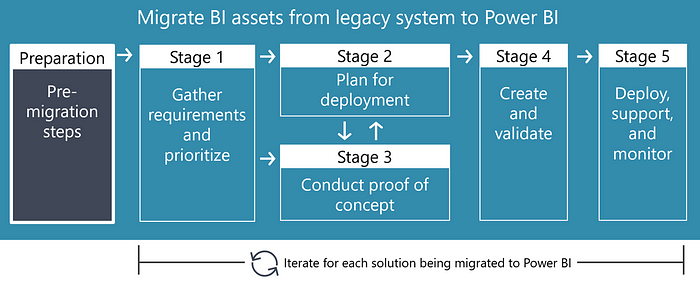
The pre-migration steps emphasize up-front planning, which is important preparation before moving through the five migration stages. Most of the pre-migration steps will occur once, though for larger organizations some portions may be iterative for each business unit or departmental area.
The output from the pre-migration steps includes an initial governance model, initial high-level deployment planning, in addition to an inventory of the reports and data to be migrated. Additional information from activities in Stages 1, 2, and 3 will be necessary to fully estimate the level of effort for migrating individual solutions.
Create cost/benefit analysis and evaluation
Clarity on the business case and BI strategy to reach a specific desired future state.
Clarity on what success means, and how to measure progress and success for the migration initiative.
Cost estimates and return on investment (ROI) calculation results.
Successful results for several productive Power BI initiatives that are smaller in scope and complexity level.
Identify stakeholders and executive support
Ensure alignment with stakeholders on the business case and BI strategy.
Include representatives from throughout the business units — even if their content is slated for migration on a later timetable — to understand their motivations and concerns.
Involve Power BI champions early.
Create, and follow, a communication plan with stakeholders.
Generate initial governance model
Specific goals for Power BI adoption and where Power BI fits into the overall BI strategy for the organization.
How the Power BI administrator role will be handled, particularly in decentralized organizations.
Policies related to achieving trusted data: use of authoritative data sources, addressing data quality issues, and use of consistent terminology and common definitions.
Security and data privacy strategy for data sources, data models, reports, and content delivery to internal and external users.
How internal and external compliance, regulatory, and audit requirements will be met.
Tip — If you fear you’re starting to overcommunicate, then it’s probably just about right.
Conduct initial deployment planning
Initial deployment planning involves defining standards, policies, and preferences for the organization’s Power BI implementation.
Note that Stage 2 references solution-level deployment planning. The Stage 2 activities should respect the organizational-level decisions whenever possible.
Power BI tenant admin setting decisions, which should be documented.
Workspace management decisions, which should be documented.
Considerations and preferences related to data and content distribution methods, such as apps, workspaces, sharing, subscriptions, and embedding of content.
Preferences related to dataset modes, such as use of Import mode, DirectQuery mode, or combining the two modes in a Composite model.
Working with shared datasets for reusability.
Applying data certification to promote the use of authoritative and trustworthy data.
Use of different report types, including Power BI reports, Excel reports, or paginated reports for different use cases or business units.
Change management approaches for managing centralized BI artifacts and business-managed BI artifacts.
Training plans for consumers, data modelers, report authors, and administrators.
Support for content authors by using Power BI Desktop templates, custom visuals, and documented report design standards.
Procedures and processes for managing user requirements, such as requesting new licenses, adding new gateway data sources, gaining permission to gateway data sources, requesting new workspaces, workspace permissions changes, and other common requirements that may be encountered on a regular basis.
Important — Deployment planning is an iterative process. Deployment decisions will be refined and augmented many times as your organization’s experience with Power BI grows, and as Power BI evolves. The decisions made during this process will be used during the solution-level deployment planning discussed in Stage 2 of the migration process.
Establish initial architecture
Power BI tenant setup and integration with Azure Active Directory.
Define Power BI administrators.
Procure and assign initial user licenses.
Configure and review Power BI tenant admin settings.
Setup workspace roles and assign access to Azure Active Directory security groups and users.
Configure an initial data gateway cluster — with a plan to update regularly.
Procure initial Premium capacity license (if applicable).
Configure Premium capacity workloads — with a plan to manage on an ongoing basis.
Define success criteria for migration
What are the specific motivations and objectives for this migration? For more information, see Power BI migration overview (Consider migration reasons). This article describes the most common reasons for migrating to Power BI. Certainly, your objectives should be specified at the organizational level. Beyond that, migrating one legacy BI solution may benefit significantly from cost savings, whereas migrating a different legacy BI solution may focus on gaining workflow optimization benefits.
What’s the expected cost/benefit or ROI for this migration? Having a clear understanding of expectations related to cost, increased capabilities, decreased complexity, or increased agility, is helpful in measuring success. It can provide guiding principles to help with decision-making during the migration process.
What key performance indicators (KPIs) will be used to measure success? The following list presents some example KPIs:
— Number of reports rendered from legacy BI platform, decreasing month over month.
— Number of reports rendered from Power BI, increasing month over month.
— Number of Power BI report consumers, increasing quarter over quarter.
— Percentage of reports migrated to production by target date.
— Cost reduction in licensing cost year over year.
Prepare inventory of existing reports
Preparing an inventory of existing reports in the legacy BI platform is a critical step towards understanding what already exists. The outcome of this step is an input to assessing the migration effort level. Activities related to preparing an inventory may include:
Inventory of reports: Compile a list of reports and dashboards that are migration candidates.
Inventory of data sources: Compile a list of all data sources accessed by existing reports. It should include both enterprise data sources as well as departmental and personal data sources. This process may unearth data sources not previously known to the IT department, often referred to as shadow IT.
Audit log: Obtain data from the legacy BI platform audit log to understand usage patterns and assist with prioritization. Important information to obtain from the audit log includes:
Average number of times each report was executed per week/month/quarter.
Average number of consumers per report per week/month/quarter.
The consumers for each report, particularly reports used by executives.
Most recent date each report was executed.
Note — In many cases, the content isn’t migrated to Power BI exactly as is. The migration represents an opportunity to redesign the data architecture and/or improve report delivery. Compiling an inventory of reports is crucial to understanding what currently exists so you can begin to assess what refactoring needs to occur. The remaining articles in this series describe possible improvements in more detail.
Explore automation options
It isn’t possible to completely automate a Power BI conversion process end-to-end.
Compiling the existing inventory of data and reports is a possible candidate for automation when you have an existing tool that can do it for you. The extent to which automation can be used for some portions of the migration process — such as compiling the existing inventory — highly depends upon the tools you have.
Gather requirements to migrate to Power BI
This section describes Stage 1, which is concerned with gathering and prioritizing requirements when migrating to Power BI.
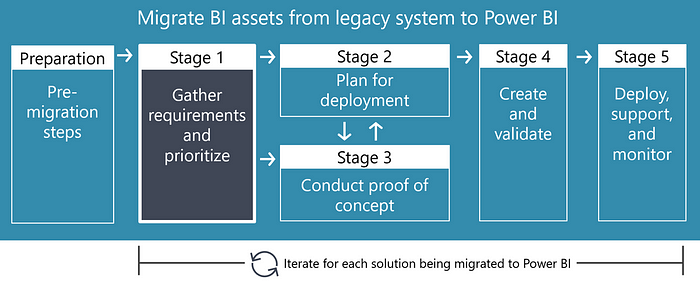
The emphasis of Stage 1 is on information gathering and planning for an individual solution that will be migrated to Power BI.
The output from Stage 1 includes detailed requirements that have been prioritized. However, additional activities in Stages 2 and 3 must be completed to fully estimate the level of effort.
Important — Stages 1–5 represent activities related to one specific solution. There are decisions and activities at the organizational/tenant level which impact the process at the solution level. Some of those higher-level planning activities are discussed in the Power BI migration overview article. When appropriate, defer to the organizational-level decisions for efficiency and consistency.
Compile requirements
The inventory of existing BI artifacts, compiled in the pre-migration steps, become the input for the requirements of the new solution to be created in Power BI. Collecting requirements is about understanding the current state, as well as what items users would like changed or refactored when reports are redesigned in Power BI. Detailed requirements will useful for solution deployment planning in Stage 2, during creation of a proof of concept in Stage 3, and when creating the production-ready solution in Stage 4.
Gather report requirements
Purpose, audience, and expected action: Identify the purpose and business process applicable to each report, as well as the audience, analytical workflow, and expected action to be taken by report consumers.
How consumers use the report: Consider sitting with report consumers of the existing report to understand exactly what they do with it. You may learn that certain elements of the report can be eliminated or improved in the new Power BI version. This process involves additional time investment but it’s valuable for critical reports or reports that are used often.
Owner and subject matter expert: Identify the report owner and any subject matter expert(s) associated with the report or data domain. They may become the owners of the new Power BI report going forward. Include any specific change management requirements (which typically differ between IT-managed and business-managed solutions) as well as approvals and sign-offs, which will be required when changes are made in the future.
Content delivery method: Clarify report consumer expectations for content delivery. It may be on-demand, interactive execution, embedded within a custom application, or delivery on a schedule using an e-mail subscription. There may also be requirements to trigger alert notifications.
Interactivity needs: Determine must-have and nice-to-have interactivity requirements, such as filters, drill-down, or drill-through.
Data sources: Ensure all data sources required by the report are discovered, and data latency needs (data freshness) are understood. Identify historical data, trending, and data snapshot requirements for each report so they can be aligned with the data requirements. Data source documentation can also be useful later on when performing data validation of a new report with its source data.
Security requirements: Clarify security requirements (such as allowed viewers, allowed editors, and any row-level security needs), including any exceptions to normal organizational security. Document any data sensitivity level, data privacy, or regulatory/compliance needs.
Calculations, KPIs, and business rules: Identify and document all calculations, KPIs, and business rules that are currently defined within the existing report so they can be aligned with the data requirements.
Usability, layout, and cosmetic requirements: Identify specific usability, layout, and cosmetic needs related to data visualizations, grouping and sorting requirements, and conditional visibility. Include any specific considerations related to mobile device delivery.
Printing and exporting needs: Determine whether there are any requirements specific to printing, exporting, or pixel-perfect layout. These needs will influence which type of report will be most suitable (such as a Power BI, Excel, or paginated report). Be aware that report consumers tend to place a lot of importance on how they’ve always done things, so don’t be afraid to challenge their way of thinking. Be sure to talk in terms of enhancements rather than change.
Risks or concerns: Determine whether there are other technical or functional requirements for reports, as well as any risks or concerns regarding the information being presented in them.
Open issues and backlog items: Identify any future maintenance, known issues, or deferred requests to add to the backlog at this time.
Consider ranking requirements by classifying them as must have or nice to have. Frequently consumers ask for everything they may possibly need up-front because they believe it may be their only chance to make requests. Also, when addressing priorities in multiple iterations, make the backlog available to stakeholders. It helps with communication, decision-making, and the tracking of pending commitments.
Gather data requirements
Existing queries: Identify whether there are existing report queries or stored procedures that can be used by a DirectQuery model or a Composite model, or can be converted to an Import model.
Types of data sources: Compile the types of data sources that are necessary, including centralized data sources (such as an enterprise data warehouse) as well as non-standard data sources (such as flat files or Excel files that augment enterprise data sources for reporting purposes). Finding where data sources are located, for purposes of data gateway connectivity, is important too.
Data structure and cleansing needs: Determine the data structure for each requisite data source, and to what extent data cleansing activities are necessary.
Data integration: Assess how data integration will be handled when there are multiple data sources, and how relationships can be defined between each model table. Identify specific data elements needed to simplify the model and reduce its size.
Acceptable data latency: Determine the data latency needs for each data source. It will influence decisions about which data storage mode to use. Data refresh frequency for Import model tables is important to know too.
Data volume and scalability: Evaluate data volume expectations, which will factor into decisions about large model support and designing DirectQuery or Composite models. Considerations related to historical data needs are essential to know too. For larger datasets, determining the incremental data refresh rules will also be necessary.
Measures, KPIs, and business rules: Assess needs for measures, KPIs, and business rules. They will impact decisions regarding where to apply the logic: in the dataset or the data integration process.
Master data and data catalog: Consider whether there are master data issues requiring attention. Determine if integration with an enterprise data catalog is appropriate for enhancing discoverability, accessing definitions, or producing consistent terminology accepted by the organization.
Security and data privacy: Determine whether there are any specific security or data privacy considerations for datasets, including row-level security requirements.
Open issues and backlog items: Add any known issues, known data quality defects, future maintenance, or deferred requests to the backlog at this time.
Important — Data reusability can be achieved with shared datasets, which can optionally be certified to indicate trustworthiness and improve discoverability. Data preparation reusability can be achieved with dataflows to reduce repetitive logic in multiple datasets. Dataflows can also significantly reduce the load on source systems because the data is retrieved less often — multiple datasets can then import data from the dataflow.
Data Driven Investor | Microsoft Having An 'Edge' Over Chrome
A Brief History I was never a fan of browsers, well to be exact I was only a fan of one, Chrome. It has been my…
Identify improvement opportunities
In most situations, some modifications and improvements occur. It’s rare that a direct one-to-one migration occurs without any refactoring or enhancement. Three types of improvements you may consider include:
Consolidation of reports: Similar reports may be consolidated using techniques such as filters, bookmarks, or personalization. Having fewer reports, which are each more flexible, can significantly improve the experience for report consumers. Consider optimizing datasets for Q&A (natural language querying) to deliver even greater flexibility to report consumers, allowing them to create their own visualizations.
Efficiency improvements: During requirements gathering, improvements can often be identified. For instance, when analysts compile numbers manually or when a workflow can be streamlined. Power Query can play a large role in replacing manual activities that are currently performed. If business analysts find themselves performing the same activities to cleanse and prepare data on a regular basis, repeatable Power Query data preparation steps can yield significant time savings and reduce errors.
Centralization of data model: An authoritative and certified dataset serves as the backbone for managed self-service BI. In this case, the data is managed once, and analysts have flexibility to use and augment that data to meet their reporting and analysis needs.
Note
For more information about centralization of data models, read about discipline at the core and flexibility at the edge.
Prioritize and assess complexity
At this point, the initial inventory is available and may include specific requirements. When prioritizing the initial set of BI artifacts ready for migration, reports and data should be considered collectively as well as independently of each other.
Identify high priority reports, which may include reports that:
Bring significant value to the business.
Are executed frequently.
Are required by senior leadership or executives.
Involve a reasonable level of complexity (to improve chances of success during the initial migration iterations).
Identify high priority data, which may include data that:
Contains critical data elements.
Is common organizational data that serves many use cases.
May be used to create a shared dataset for reuse by reports and many report authors.
Involves a reasonable level of complexity (to improve chances of success when in the initial migration iterations).
Plan deployment to migrate to Power BI
This section describes Stage 2, which is concerned with planning the migration for a single Power BI solution.
The focus of Stage 2 is on defining how the requirements that were defined in Stage 1 are used to migrate a solution to Power BI.
The output from Stage 2 includes as many specific decisions as possible to guide the deployment process.
Decision-making of this nature is an iterative and non-linear process. Some planning will have already occurred in the pre-migration steps. Learnings from a proof of concept (described in Stage 3) may occur in parallel with deployment planning. Even while creating the solution (described in Stage 4), additional information may arise that influences deployment decisions.
Important — Stages 1–5 represent activities related to one specific solution. There are decisions and activities at the organizational/tenant level which impact the process at the solution level. Some of those higher-level planning activities are discussed in the Power BI migration overview article. When appropriate, defer to the organizational-level decisions for efficiency and consistency.
Choose Power BI product
One of the first decisions is to choose the Power BI product. It’s a decision between the Power BI service or Power BI Report Server. Once content has been published, many additional options become available, such as embedding, mobile delivery, and email subscriptions.
For more information about architectural considerations, see Section 3 of the Planning a Power BI enterprise deployment whitepaper.
Caution — If you’re tempted to rely on using Power BI Desktop files stored in a file system, be aware that it’s not an optimal approach. Using the Power BI service (or Power BI Report Server) has significant advantages for security, content distribution, and collaboration. The ability to audit and monitor activities is also enabled by the Power BI service.
Decide on workspace management approach
Workspaces are a core concept of the Power BI service, which makes workspace management an important aspect of planning. Questions to ask include:
Is a new workspace needed for this new solution?
Will separate workspaces be needed to accommodate development, test, and production?
Will separate workspaces be used for data and reports, or will a single workspace be sufficient? Separate workspaces have numerous advantages, especially for securing datasets. When necessary, they can be managed separately from those users who publish reports.
What are the security requirements for the workspace? It influences planning for workspace roles. If an app will be used by content consumers, permissions for the app are managed separately from the workspace. Distinct permissions for app viewers allow additional flexibility in meeting security requirements for read-only consumers of reports or dashboards.
Can existing groups be used for securing the new content? Both Azure Active Directory and Microsoft 365 groups are supported. When aligned with existing processes, using groups makes permissions management easier than assignments to individual users.
Are there any security considerations related to external guest users? You may need to work with your Azure Active Directory administrator and your Power BI administrator to configure guest user access.
Tip — Consider creating a workspace for a specific business activity or project. You may be tempted to start off structuring workspaces based on your organizational structure (such as a workspace per department), but this approach frequently ends up being too broad.
Determine how content will be consumed
Will a Power BI app (which comprises reports and dashboards from a single workspace) be the best way to deliver content to consumers, or will direct access to a workspace be sufficient for content viewers?
Will certain reports and dashboards be embedded elsewhere, such as Teams, SharePoint Online, or a secure portal or website?
Will consumers access content using mobile devices? Requirements to deliver reports to small form factor devices will influence some report design decisions.
Decide if other content may be created
There are several key decisions to be made related to allowing consumers to create new content, such as:
Will consumers be allowed to create new reports from the published dataset? This capability can be enabled by assigning dataset build permission to a user.
If consumers want to customize a report, can they save a copy of it and personalize it to meet their needs?
Caution — Although the Save a copy capability is a nice feature, it should be used with caution when the report includes certain graphics or header/footer messages. Since logos, icons, and textual messages often relate to branding requirements or regulatory compliance, it’s important to carefully control how they’re delivered and distributed. If Save a copy is used, but the original graphics or header/footer messages remain unchanged by the new author, it can result in confusion about who actually produced the report. It can also reduce the meaningfulness of the branding.
Evaluate needs for Premium capacity
Additional capabilities are available when a workspace is stored on a Premium capacity. Here are several reasons why workspaces on Premium capacity can be advantageous:
Content can be accessed by consumers who don’t have a Power BI Pro license.
Support for large datasets.
Support for more frequent data refreshes.
Support for using the full feature set of dataflows.
Enterprise features, including deployment pipelines and the XMLA endpoint.
Support for paginated reports (when the workload is enabled).
Determine data acquisition method
Can an existing Power BI shared dataset be used, or is the creation of a new Power BI dataset appropriate for this solution?
Does an existing shared dataset need to be augmented with new data or measures to meet additional needs?
Which data storage mode will be most appropriate? Options include Import, DirectQuery, Composite, or Live Connection.
Should aggregations be used to enhance query performance?
Will creation of a dataflow be useful and can it serve as a source for numerous datasets?
Will a new gateway data source need to be registered?
Decide where original content will be stored
In addition to planning the target deployment destination, it’s also important to plan where the original — or source — content will be stored, such as:
Specify an approved location for storing the original Power BI Desktop (.pbix) files. Ideally, this location is available only to people who edit the content. It should align with how security is set up in the Power BI service.
Use a location for original Power BI Desktop files that includes versioning history or source control. Versioning permits the content author to revert to a previous file version, if necessary. OneDrive for Business or SharePoint work well for this purpose.
Specify an approved location for storing non-centralized source data, such as flat files or Excel files. It should be a path that any of the dataset authors can reach without error and is backed up regularly.
Specify an approved location for content exported from the Power BI service. The goal is to ensure that security defined in the Power BI service isn’t inadvertently circumvented.
Important — Specifying a protected location for original Power BI Desktop files is particularly important when they contain imported data.
Assess the level of effort
Once sufficient information is available from the requirements (which were described in Stage 1) and the solution deployment planning process, it’s now possible to assess the level of effort. It’s then possible to formulate a project plan with tasks, timeline, and responsibility.
Tip — Labor costs — salaries and wages — are usually among the highest expenses in most organizations. Although it can be difficult to accurately estimate, productivity enhancements have an excellent return on investment (ROI).
Conduct proof of concept to migrate to Power BI
This section describes Stage 3, which is concerned with conducting a proof of concept (POC) to mitigate risk and address unknowns as early as possible when migrating to Power BI.
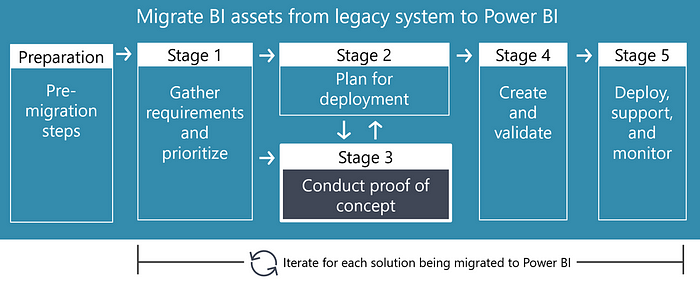
The focus of Stage 3 is to address unknowns and mitigate risks as early as possible. A technical POC is helpful for validating assumptions. It can be done iteratively alongside solution deployment planning (described in Stage 2).
The output from this stage is a Power BI solution that’s narrow in scope, addresses the initial open questions, and is ready for additional work in Stage 4 to make it production-ready.
Important — We don’t intend for the POC to be disposable work. Rather, we expect it to be an early iteration of the production-ready solution. In your organization, you may refer to this activity as a prototype, pilot, mockup, quick start, or minimally viable product (MVP). Conducting a POC isn’t always necessary and it could even happen informally.
Set POC goals and scope
Verify your assumptions about how a feature works.
Educate yourself on differences in how Power BI works compared with the legacy BI platform.
Validate initial understandings of certain requirements with subject matter experts.
Create a small dataset with real data to understand and detect any issues with the data structure, relationships, data types, or data values.
Experiment with, and validate, DAX syntax expressions used by model calculations.
Test data source connectivity using a gateway (if it’s to be a gateway source).
Test data refresh using a gateway (if it’s to be a gateway source).
Verify security configurations, including row-level security when applicable.
Experiment with layout and cosmetic decisions.
Verify that all functionality in the Power BI service works as expected.
The POC scope is dependent on what the unknowns are, or which goals need to be validated with colleagues. To reduce complexity, keep a POC as narrow as possible in terms of scope.
Most often with a migration, requirements are well known because there’s an existing solution to start from. However, depending on the extent of improvements to be made or existing Power BI skills, a POC still provides significant value. In addition, rapid prototyping with consumer feedback may be appropriate to quickly clarify requirements — especially if enhancements are made.
Important — Even if a POC includes only a subset of data, or includes only limited visuals, it’s often important to take it from start to finish. That is, from development in Power BI Desktop to deployment to a development workspace in the Power BI service. It’s the only way to fully accomplish the POC objectives. It’s particularly true when the Power BI service must deliver critical functionality that you haven’t used before, like a DirectQuery dataset using single sign-on. During the POC, focus your efforts on aspects you’re uncertain about or need to verify with others.
Handle differences in Power BI
Power BI can be used as a model-based tool or as a report-based tool. A model-based solution involves developing a data model, whereas a report-based solution connects to an already-deployed data model.
Due to its extreme flexibility, there are some aspects about Power BI that may be fundamentally different from the legacy BI platform you’re migrating from.
Consider redesigning the data architecture
If you’re migrating from a legacy BI platform that has its own semantic layer, then the creation of an Import dataset is likely to be a good option. Power BI functions best with a star schema table design. Therefore, if the legacy semantic layer is not a star schema, it’s possible that some redesign may be required to fully benefit from Power BI. Putting effort into defining a semantic layer adhering to star schema design principles (including relationships, commonly used measures, and friendly organizational terminology) serves as an excellent starting point for self-service report authors.
If you’re migrating from a legacy BI platform where reports reference relational data sources using SQL queries or stored procedures, and if you’re planning to use Power BI in DirectQuery mode, you may be able to achieve close to a one-to-one migration of the data model.
Caution — If you see the creation of lots of Power BI Desktop files comprising a single imported table, it’s usually an indicator that the design isn’t optimal. Should you notice this situation, investigate whether the use of shared datasets that are created using a star schema design could achieve a better result.
Decide how to handle dashboard conversions
In the BI industry, a dashboard is a collection of visuals that displays key metrics on a single page. However, in Power BI, a dashboard represents a specific visualization feature that can only be created in the Power BI service. When migrating a dashboard from a legacy BI platform, you have two choices:
The legacy dashboard can be recreated as a Power BI report. Most reports are created with Power BI Desktop. Paginated reports and Excel reports are alternative options, too.
The legacy dashboard can be recreated as a Power BI dashboard. Dashboards are a visualization feature of the Power BI service. Dashboard visuals are often created by pinning visuals from one or more reports, Q&A, or Quick Insights.
Tip — Because dashboards are a Power BI content type, refrain from using the word dashboard in the report or dashboard name.
Focus on the big picture when recreating visuals
Every BI tool has its strengths and focus areas. For this reason, the exact report visuals you depended on in a legacy BI platform may not have a close equivalent in Power BI.
When recreating report visuals, focus more on the big picture business questions that are being addressed by the report. It removes the pressure to replicate the design of every visual in precisely the same way. While content consumers appreciate consistency when using migrated reports, it’s important not to get caught up in time-consuming debates about small details.
Create content to migrate to Power BI
This section describes Stage 4, which is concerned with creating and validating content when migrating to Power BI.
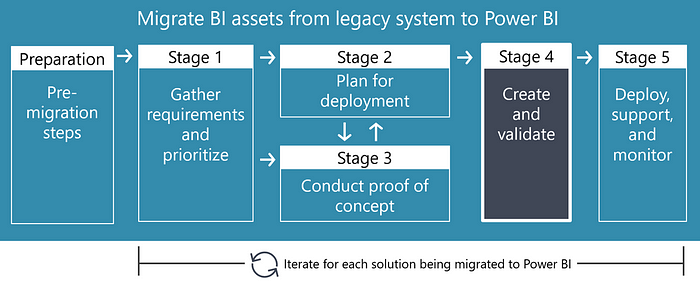
The focus of Stage 4 is performing the actual work to convert the proof of concept (POC) to a production-ready solution.
The output from this stage is a Power BI solution that has been validated in a development workspace and is ready for deployment to production.
Create the production solution
At this juncture, the same person who performed the POC may carry on with producing the production-ready Power BI solution. Or, someone different may be involved. If timelines are not jeopardized, it’s great to get people involved who will be responsible for Power BI development in the future. This way, they can actively learn.
Important — Reuse as much of the work from the POC as possible.
Develop new import dataset
You may choose to create a new Import dataset when an existing Power BI dataset doesn’t already exist to meet your needs, or if it can’t be enhanced to meet your needs.
Ideally, from the very beginning, consider decoupling the development work for data and reports. Decoupling data and reports will facilitate the separation of work, and permissions, when different people are responsible for data modeling and reports. It makes for a more scalable approach and encourages data reusability.
The essential activities related to development of an Import dataset include:
Acquire data from one or more data sources (which may be a Power BI dataflow).
Create the dataset model, including date tables.
Create and verify model relationships.
Define measures.
Set up row-level security, if necessary.
Configure synonyms and optimize Q&A.
Plan for scalability, performance, and concurrency, which may influence your decisions about data storage modes, such as using a Composite model or aggregations.
Tip — If you have different development/test/production environments, consider parameterizing data sources. It will make deployment, described in Stage 5, significantly easier.
Develop new reports and dashboards
The essential activities related to development of a Power BI report or dashboard include:
Decide on using a Live Connection to an existing data model, or creating a new data model
When creating a new data model, decide on the data storage mode for model tables (Import, DirectQuery, or Composite).
Decide on the best data visualization tool to meet requirements: Power BI Desktop, Paginated Report Builder, or Excel.
Decide on the best visuals to tell the story the report needs to tell, and to address the questions the report needs to answer.
Ensure all visuals present clear, concise, and business-friendly terminology.
Address interactivity requirements.
When using Live Connection, add report-level measures.
Create a dashboard in the Power BI service, especially when consumers want an easy way to monitor key metrics.
Note — Many of these decisions will have been made in earlier stages of planning or in the technical POC.
Validate the solution
There are four main aspects to validation of a Power BI solution:
Data accuracy
Security
Functionality
Performance
Validate data accuracy
As a one-time effort during the migration, you’ll need to ensure the data in the new report matches what’s displayed in the legacy report. Or — if there’s a difference — be able to explain why. It’s more common than you might think to find an error in the legacy solution that gets resolved in the new solution.
As part of ongoing data validation efforts, the new report will typically need to be cross-checked with the original source system. Ideally, this validation occurs in a repeatable way every time you publish a report change.
Validate security
Data permissions
Access to datasets, reports, and dashboards
In an Import dataset, data permissions are applied by defining row-level security (RLS). It’s also possible that data permissions are enforced by the source system when using DirectQuery storage mode (possibly with single sign-on).
The main ways to grant access to Power BI content are:
Workspace roles (for content editors and viewers).
App permissions applied to a packaged set of workspace content (for viewers).
Sharing an individual report or dashboard (for viewers).
Tip — We recommend training content authors on how to manage security effectively. It’s also important to have robust testing, auditing and monitoring in place.
Validate functionality
It’s the time to double-check dataset details like field names, formatting, sorting, and default summarization behavior. Interactive report features, such as slicers, drill down, drillthrough, expressions, buttons, or bookmarks, should all be verified, too.
During the development process, the Power BI solution should be published to a development workspace in the Power BI service on a regular basis. Verify all functionality works as expected in the service, such as the rendering of custom visuals. It’s also a good time to do further testing. Test scheduled refresh, Q&A, and how reports and dashboards look on a mobile device.
Validate performance
Performance of the Power BI solution is important for consumer experience. Most reports should present visuals in under 10 seconds. If you have reports that take longer to load, pause and reconsider what may be contributing to delays. Report performance should be assessed regularly in the Power BI service, in addition to Power BI Desktop.
Many performance issues arise from substandard DAX (Data Analysis eXpressions), poor dataset design, or suboptimal report design (for instance, trying to render too many visuals on a single page). Technical environment issues, such as the network, an overloaded data gateway, or how a Premium capacity is configured can also contribute to performance issues. For more information, see the Optimization guide for Power BI and Troubleshoot report performance in Power BI.
Document the solution
There are two main types of documentation that are useful for a Power BI solution:
Dataset documentation
Report documentation
Documentation can be stored wherever it’s most easily accessed by the target audience. Common options include:
Within a SharePoint site: A SharePoint site may exist for your Center of Excellence or an internal Power BI community site.
Within an app: URLs may be configured when publishing a Power BI app to direct the consumer to more information.
Within individual Power BI Desktop files: Model elements, like tables and columns, can define a description. These descriptions appear as tooltips in the Fields pane when authoring reports.
Tip — If you create a site to serve as a hub for Power BI-related documentation, consider customizing the Get Help menu with its URL location.
Create dataset documentation
Dataset documentation is targeted at users who will be managing the dataset in the future. It’s useful to include:
Design decisions made and reasons why.
Who owns, maintains, and certifies datasets.
Data refresh requirements.
Custom business rules defined in datasets.
Specific dataset security or data privacy requirements.
Future maintenance needs.
Known open issues or deferred backlog items.
You may also elect to create a change log that summarizes the most important changes that have happened to the dataset over time.
Create report documentation
Report documentation, which is typically structured as a walk-through targeted at report consumers, can help consumers get more value from your reports and dashboards. A short video tutorial often works well.
You may also choose to include additional report documentation on a hidden page of your report. It could include design decisions and a change log.
Deploy to Power BI
This section describes Stage 5, which is concerned with deploying, supporting, and monitoring content when migrating to Power BI.
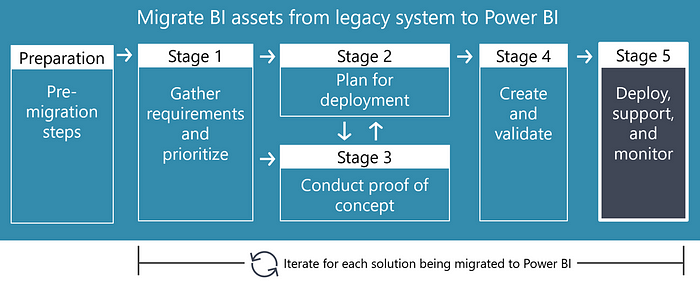
The primary focus of Stage 5 is to deploy the new Power BI solution to production.
The output from this stage is a production solution ready for use by the business. When working with an agile method, it’s acceptable to have some planned enhancements that will be delivered in a future iteration. Support and monitoring are also important at this stage, and on an ongoing basis.
Tip — Except for running in parallel and decommissioning the legacy reports, which are discussed below, the topics discussed in this article also apply to a standard Power BI implementation project.
Deploy to test environment
For IT-managed solutions, or solutions that are critical to business productivity, there’s generally a test environment. A test environment sits between development and production, and it’s not necessary for all Power BI solutions. A test workspace can serve as a stable location, separated from development, for user acceptance testing (UAT) to occur before release to production.
If your content has been published to a workspace on Premium capacity, deployment pipelines can simplify the deployment process to development, test, and production workspaces. Alternatively, publishing may be done manually or with PowerShell scripts.
Deploy to test workspace
Key activities during a deployment to the test workspace typically include:
Connection strings and parameters: Adjust dataset connection strings if the data source differs between development and test. Parameterization can be used to effectively manage connection strings.
Workspace content: Publish datasets and reports to the test workspace, and create dashboards.
App. Publish an app using the content from the test workspace, if it will form part of the UAT process. Usually, app permissions are restricted to a small number of people involved with UAT.
Data refresh: Schedule the dataset refresh for any Import datasets for the period when UAT is actively occurring.
Security: Update or verify workspace roles. Testing workspace access includes a small number of people who are involved with UAT.
Note — For more information about options for deployment to development, test, and production, see Section 9 of the Planning a Power BI enterprise deployment whitepaper.
Conduct user acceptance testing
Generally, UAT involves business users who are subject matter experts. Once verified, they provide their approval that the new content is accurate, meets requirements, and may be deployed for wider consumption by others.
The extent to which this UAT process is formal, including written sign-offs, will depend on your change management practices.
Deploy to production environment
There are several considerations for deploying to the production environment.
Conduct a staged deployment
If you’re trying to minimize risk and user disruption, or if there are other concerns, you may opt to perform a staged deployment. The first deployment to production may involve a smaller group of pilot users. With a pilot, feedback can be actively requested from the pilot users.
Expand permissions in the production workspace, or the app, gradually until all target users have permission to the new Power BI solution.
Tip — Use the Power BI Activity Log to understand how consumers are adopting and using the new Power BI solution.
Handle additional components
During the deployment process, you may need to work with your Power BI administrators to address other requirements that are needed to support the entire solution, such as:
Gateway maintenance: A new data source registration in the data gateway may be required.
Gateway drivers and connectors: A new proprietary data source may require installation of a new driver or custom connector on each server in the gateway cluster.
Create a new Premium capacity: You may be able to use an existing Premium capacity. Or, there may be situations when a new Premium capacity is warranted. It could be the case when you purposely wish to separate a departmental workload.
Set up a Power BI dataflow: Data preparation activities can be set up once in a Power BI dataflow using Power Query Online. It helps avoid replicating data preparation work in many different Power BI Desktop files.
Register a new organizational visual: Organizational visual registration can be done in the admin portal for custom visuals that didn’t originate from AppSource.
Set featured content: A tenant setting exists that controls who may feature content in the Power BI service home page.
Set up sensitivity labels: All sensitivity labels are integrated with Microsoft Information Protection.
Deploy to production workspace
Change management: If necessary, obtain approval to deploy, and communicate deployment to the user population using your standard change management practices. There may be an approved change management window during which production deployments are allowed. Usually, it’s applicable to IT-managed content and much less frequently applied to self-service content.
Rollback plan: With a migration, the expectation is that it’s the migration of a new solution for the first time. If content does already exist, it’s wise to have a plan to revert to the previous version, should it become necessary. Having previous versions of the Power BI Desktop files (using SharePoint or OneDrive versioning) works well for this purpose.
Connection strings and parameters: Adjust dataset connection strings when the data source differs between test and production. Parameterization can be used effectively for this purpose.
Data refresh: Schedule the dataset refresh for any imported datasets.
Workspace content: Publish datasets and reports to the production workspace, and create dashboards. Deployment pipelines can simplify the process to deploy to development, test, and production workspaces if your content has been published to workspaces on Premium capacity.
App: If apps are part of your content distribution strategy, publish an app using the content from the production workspace.
Security: Update and verify workspace roles based on your content distribution and collaboration strategy.
Dataset settings: Update and verify settings for each dataset, including:
-Endorsement (such as certified or promoted)
- Gateway connection or data source credentials
- Scheduled refresh
Report and dashboard settings: Update and verify settings for each report and dashboard. The most important settings include:
- Description
- Contact person or group
Subscriptions: Set up report subscriptions, if necessary.
Important- At this point, you have reached a big milestone. Celebrate your accomplishment at completing the migration.
Communicate with users
Announce the new solution to consumers. Let them know where they can find the content, as well as associated documentation, FAQs, and tutorials. To introduce the new content, consider hosting a lunch-and-learn type of session or prepare some on-demand videos.
Be sure to include instructions on how to request help, as well as how to provide feedback.
Conduct a retrospective
Consider conducting a retrospective to examine what went well with the migration, and what could be done better with the next migration.
Run in parallel
In many situations, the new solution will run in parallel to the legacy solution for a predetermined time. Advantages of running in parallel include:
Risk reduction, particularly if the reports are considered mission-critical.
Allows time for users to become accustomed to the new Power BI solution.
Allows for the information presented in Power BI to be cross-referenced to the legacy reports.
Decommission the legacy report
At some point, the reports migrated to Power BI should be disabled in the legacy BI platform. Decommissioning legacy reports can occur when:
The predetermined time for running in parallel — which should have been communicated to the user population — has expired. It’s commonly 30–90 days.
All users of the legacy system have access to the new Power BI solution.
Significant activity is no longer occurring on the legacy report.
No issues have occurred with the new Power BI solution that could impact user productivity.
Monitor the solution
Events from the Power BI activity log can be used to understand usage patterns of the new solution (or the execution log for content deployed to Power BI Report Server). Analyzing the activity log can help determine whether actual use differs from expectations. It can also validate that the solution is adequately supported.
Here’s some questions that can be addressed by reviewing the activity log:
How frequently is the content being viewed?
Who is viewing the content?
Is the content typically viewed through an app or a workspace?
Are most users using a browser or mobile application?
Are subscriptions being used?
Are new reports being created that are based on this solution?
Is the content being updated frequently?
How is security defined?
Are problems occurring regularly, such as data refresh failures?
Are concerning activities happening (for instance, significant export activity or numerous individual report shares) which could mean additional training might be warranted?
Important — Be sure to have someone regularly review the activity log. Merely capturing it and storing the history does have value for auditing or compliance purposes. However, the real value is when proactive action can be taken.
Support the solution
Although the migration is complete, the post-migration period is vital for addressing issues and handling any performance concerns. Over time, the migrated solution will likely undergo changes as business needs evolve.
Support tends to happen a little differently depending on how self-service BI is managed across the organization. Power BI champions throughout the business units often informally act as first-line support. Although it’s an informal role, it’s a vital one that should be encouraged.
Having a formal support process, staffed by IT with support tickets, is also essential for handling routine system-oriented requests and for escalation purposes.
You may also have a Center of Excellence (COE) that acts like internal consultants who support, educate, and govern Power BI in the organization. A COE can be responsible for curating helpful Power BI content in an internal portal.
Lastly, it should be clear to content consumers to know who to contact with questions about the content, and to have a mechanism for providing feedback on issues or improvements.
Learn from customer Power BI migrations
This section, which concludes the series on migrating to Power BI, shares key lessons learned by two customers who have successfully migrated to Power BI.
International consumer goods company
An international consumer goods company, which sells hundreds of products, made the decision in 2017 to pursue a cloud-first strategy. One of the major factors for selecting Power BI as its business intelligence (BI) platform is its deep integration with Azure and Microsoft 365.
Conduct a phased migration
In 2017, the company began using Power BI. The initial organizational objective was to introduce Power BI as an additional BI tool. The decision provided content authors, consumers, and IT with the time to adapt to new ways of delivering BI. It also allowed them to build expertise in Power BI.
During the second half of 2018, a formal announcement was made declaring that Power BI was the approved BI tool for the organization. And, accordingly, all new BI development work should take place in Power BI. The availability of Power BI Premium was a key driver for making this decision. At this time, the organization discouraged the use of the former BI platform, and planning for transition commenced.
Towards the end of 2019, work began to migrate existing content from the legacy BI platform to Power BI. Some early adopters migrated their content rapidly. That helped build even more momentum with Power BI around the organization. Content owners and authors were then asked to begin preparations to fully migrate to Power BI by the end of 2020. The organization does still face challenges related to skills, time, and funding — though none of their challenges are related to the technology platform itself.
Important — Power BI had already become successful and entrenched within the organization before the business units were asked to undergo a formal migration effort away from the former BI platform.
Prepare to handle varying responses
In this large decentralized organization, there were varying levels of receptiveness and willingness to move to Power BI. Beyond concerns related to time and budget, there were staff who had made significant investments in building their skills in the former BI platform. So, the announcement about standardizing on Power BI wasn’t news welcomed by everyone. Since each business unit has its own budget, individual business units could challenge decisions such as this one. As IT tool decisions were made centrally, that resulted in some challenges for the executive sponsor and BI leaders to handle.
Important — Communication with leadership teams throughout the business units was critical to ensure they all understood the high-level organizational benefits of standardizing on Power BI. Effective communication became even more essential as the migration progressed and the decommissioning date of the legacy BI platform approached.
Focus on the bigger picture
The company found that while some migrated reports could closely replicate the original design, not every individual report could be faithfully replicated in Power BI. Although it’s to be expected — since all BI platforms are different. It did bring to light that a different design mindset was required.
Guidance was provided to content authors: focus on creating fit-for-purpose reports in Power BI, rather than attempt an exact replica of the legacy report. For this reason, subject matter experts need to be actively available during the migration process for consultation and validation. Efforts were taken to consider the report design purpose and to improve it when appropriate.
Important — Sometimes the better approach is to take on improvements during the migration. At other times, the better choice is to deliver the exact same value as before — without significant improvements — so as not to jeopardize the migration timeline.
Cautiously assess priorities
An analysis of the former BI platform was conducted to fully understand its usage. The former BI platform had thousands of published reports, of which approximately half had been accessed in the previous year. That number could be cut in half once again when assessing which reports were deemed to deliver significant value to the organization. Those reports were prioritized first for the migration.
Important — It’s very easy to overestimate how critical a report actually is. For reports that aren’t used frequently, evaluate whether they can be decommissioned entirely. Sometimes, the cheapest and easiest thing to do is nothing.
Cautiously assess complexity
Of the first prioritized reports, time estimates were compiled based on estimated effort levels: simple, medium, or complex. Although it sounds like a relatively straightforward process, don’t expect time estimates to be accurate on an individual report basis. You may find an estimate can be wildly inaccurate. For example, the company had a report that it deemed highly complex. It received a conversion estimate of 50 days by the consultants. However, the redesigned report in Power BI was completed in about 50 hours.
Decide how change management is handled
With such a high volume of BI assets, change management for the business-owned reports represented a challenge. IT-managed reports were handled according to standard change management practices. However, due to the high volume, driving change centrally for business-owned content wasn’t possible.
Important — Additional responsibility falls to the business units when it’s impractical to manage change from one central team.
Create an internal community
The company established a Center of Excellence (COE) to provide internal training classes and resources. The COE also serves as an internal consultancy group that’s ready to assist content authors with technical issues, resolution of roadblocks, and best practice guidance.
There’s also an internal Power BI community, which has been a massive success counting in excess of 1,600 members. The community is managed in Yammer. Members can ask internally relevant questions and receive answers adhering to best practices and framed within organizational constraints. This type of user-to-user interaction alleviates much of the support burden from the COE. However, the COE does monitor the questions and answers, and it gets involved in conversations when appropriate.
An extension of the internal community is the newer Power BI expert network. It includes a small number of pre-selected Power BI champions from within the organization. They are highly skilled Power BI practitioners from the business units, who are enthusiastic champions, and who actively want to solve challenges within the business. Members of the Power BI expert network are expected to abide by best practices and guidelines established by the COE, and help the broader internal Power BI community understand and implement them. Although the Power BI expert network collaborates with the COE, and can receive dedicated training, Power BI experts operate independently from the COE. Each Power BI expert may define the parameters for how they operate, bearing in mind they have other responsibilities and priorities in their official role.
Important — Have a very well defined scope for what the COE does, such as: adoption, governance, guidance, best practices, training, support, and perhaps even hands-on development. While a COE is incredibly valuable, measuring its return on investment can be difficult.
Monitor migration progress and success
Key performance indicators (KPIs) are continually monitored during the migration to Power BI. They help the company to understand trends for metrics such as number of report visits, number of active reports, and distinct users per month. Increased usage of Power BI is measured alongside decreased usage of the former BI platform, with the goal of achieving an inverse relationship. Targets are updated each month to adapt to changes. If usage isn’t happening at the desired pace, bottlenecks are identified so appropriate action can be taken.
Important — Create a migration scorecard with actionable business intelligence to monitor the success of the migration effort.
Large transportation and logistics company
A large North American transportation and logistics company is actively investing in the modernization of its data infrastructure and analytical systems.
Allow a period of gradual growth
The company started using Power BI in 2018. By mid-2019, Power BI became the preferred platform for all new BI use cases. Then, in 2020, the company focused on phasing out their existing BI platform, in addition to a variety of custom developed ASP.NET BI solutions.
Important — Power BI had many active users across the organization before commencing the phase out of their legacy BI platform and solutions.
Balance centralized and distributed groups
In the company, there are two types of BI teams: a central BI team and analytics groups distributed throughout the organization. The central BI team has ownership responsibility for Power BI as a platform, but it doesn’t own any of the content. This way, the central BI team is a technical enablement hub that supports the distributed analytics groups.
Each of the analytics groups is dedicated to a specific business unit or a shared services function. A small group may contain a single analyst, while a larger group can have 10–15 analysts.
Important — The distributed analytics groups comprise subject matter experts who are familiar with the day-to-day business needs. This separation allows the central BI team to focus primarily on technical enablement and support of the BI services and tools.
Focus on dataset reusability
Relying on custom ASP.NET BI solutions was a barrier to developing new BI solutions. The required skill set meant that the number of self-service content authors was small. Because Power BI is a much more approachable tool — specifically designed for self-service BI — it spread quickly throughout the organization once it was released.
The empowerment of data analysts within the company resulted in immediate positive outcomes. However, the initial focus with Power BI development was on visualization. While it resulted in valuable BI solutions, this focus resulted in a large number of Power BI Desktop files, each with a one-to-one relationship between the report and its dataset. It resulted in many datasets and duplication of data and business logic. To reduce duplication of data, logic, and effort, the company delivered training and provided support to content authors.
Important — Include information about the importance of data reusability in your internal training efforts. Address important concepts as early as is practical.
Test data access multiple ways
The company’s data warehouse platform is DB2. Based on the current data warehouse design, the company found that DirectQuery models — instead of Import models — worked best for their requirements.
Important — Conduct a technical proof of concept to evaluate the model storage mode that works best. Also, teach data modelers about model storage modes and how they can choose an appropriate mode for their project.
Educate authors about Premium licensing
Since it was easier to get started with Power BI (compared with their legacy BI platform), many of the early adopters were people who didn’t have a license to the previous BI tool. As expected, the number of content authors grew considerably. These content authors understandably wanted to share their content with others, resulting in a continual need for additional Power BI Pro licenses.
The company made a large investment in Premium workspaces, most notably to distribute Power BI content to many users with Power BI free licenses. The support team works with content authors to ensure they use Premium workspaces when appropriate. It avoids unnecessarily allocating Power BI Pro licenses when a user only needs to consume content.
Important — Licensing questions often arise. Be prepared to educate and help content authors to address licensing questions. Validate that user requests for Power BI Pro licenses are justified.
Understand the data gateways
Early on, the company had many personal gateways. Using an on-premises data gateway cluster shifts the management efforts to the central BI team, which allows the content author community to focus on producing content. The central BI team worked with the internal Power BI user community to reduce the number of personal gateways.
Important — Have a plan for creating and managing on-premises data gateways. Decide who is permitted to install and use a personal gateway and enforce it with gateway policies.
Formalize your support plan
As the adoption of Power BI grew within the organization, the company found that a multi-tier support approach worked well:
Layer 1: Intra-team: People learn from, and teach, each other on a day-to-day basis.
Layer 2: Power BI community: People ask questions of the internal Teams community to learn from each other and communicate important information.
Layer 3: Central BI team and COE: People submit email requests for assistance. Office hour sessions are held twice per week to collectively discuss problems and share ideas.
Important — Although the first two layers are less formal, they’re equally important as the third layer of support. Experienced users tend to rely mostly on people they know, whereas newer users (or those who are the single data analyst for a business unit or shared service) tend to rely more on formal support.
Invest in training and governance
Over the past year, the company improved its internal training offerings and enhanced its data governance program. The governance committee includes key members from each of the distributed analytics groups, plus the COE.
There are now six internal Power BI courses in their internal catalog. The Dashboard in a Day course remains a popular course for beginners. To help users deepen their skills, they deliver a series of three Power BI courses and two DAX courses.
One of their most important data governance decisions related to management of Premium capacities. The company opted to align their dedicated capacity with key analytics areas in business units and shared services. Therefore, if inefficiencies exist, the impact is felt only within that one area, and the decentralized capacity administrators are empowered to manage the capacity as they see fit.
Important — Pay attention to how Premium capacities are used, and how workspaces are assigned to them.


